Slightly less than a year ago, Microsoft began outlining its plans to overhaul Office documents with live data, culled from the Web. On Monday, Microsoft made those plans reality, shipping PowerBI for Office 365.
PowerBI, as its name suggests, is designed to facilitate “business
intelligence” by taking professional data analysis and making it more of
a self-serve option. Its most intriguing selling point is a natural
language engine, dubbed “Q&A,” which allows users to ask questions
of the data and get meaningful answers in return.
But PowerBI for Excel won’t come cheap; the option is only available under Microsoft’s Office 365 Enterprise E3 and E4 plans, and adding it will raise the price of the E3 plan from $20 per user per month to $33.
Nevertheless,
the add-on isn’t for data wonks. Although a sales manager might have
access to the quarter’s numbers, traditional “business
intelligence”—which brand of Ford has historically sold best to
30-something professionals in the Chicago metropolitan area, for
example—has traditionally been the province of companies like Oracle,
SAP, and MicroStrategy, among others. That requires mining large
databases and organizing the data in useful ways—and often presenting it
in Excel. With PowerBI, Microsoft hopes that
it can cut out the middleman. “One hundred percent of employees are
making decisions and one hundred percent could be more effective if they
had data,” said Julia White, general manager of Microsoft’s Office
division, said in an interview.
Smart data from smart sources
PowerBI’s Power View enables multiple charts and graphs to be displayed side by side. PowerBI hopes to hook customers in
three ways. First, the software can cull large data sources—both from
inside the company on Azure and SharePoint as well as public data like
Facebook, Wikipedia, an Odata feed and more—and pull it into the report,
automatically, by using the app to search a linked data catalog that
Microsoft compiled. Microsoft’s security model allows access to internal
data sources if an employee uses his or her credentials. That gives
reports a “live” element that helps prevent the report from becoming
almost immediately out of date. Second, in addition to the
traditional charts and graphs that accompany Excel spreadsheets, there
are tools like PowerMap (top), which can use location data and plot the
results on a Bing Map and PowerView, which can combine several charts
and graphs into a single view. Finally, there’s the “Q&A” tool, which allows users to use natural language queries to generate coherent results.
BI on the run
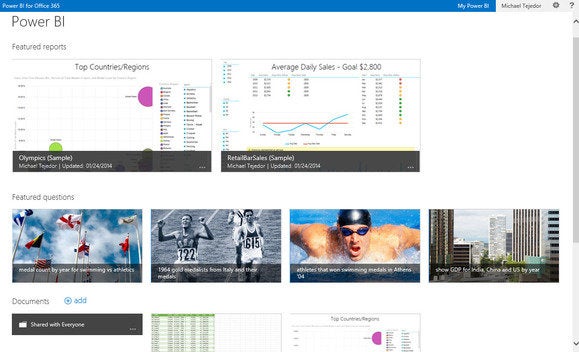
Microsoft allows users to build BI
sites—essentially examples of these living documents that live on the
Web—and access them either through the Web, or on the go using HTML5 or a
PowerBI app that Microsoft will make available on the Windows Store. Microsoft
Users can build collaborative PowerBI sites fr sharing reports and other information. And how difficult will it be for
the average user to adopt this new way of doing things? White, not
surprisingly, said it won't be too difficult. “Any one that can use a
pivot table can use this,” she said. “It’s not a real high bar.” In her own organization, White
said, what she’s seeing is that a couple of her direct reports will
prepare a BI document and pass it along. Instead of exclusively relying
on their conclusions, however, she can play with the data herself—a
“report” becomes more of a process of culling data as much as providing a
fixed set of conclusions. Microsoft said that Carnegie Mellon University, Revlon, and Trek had all trialed the technology. Tracking down and discovering a
comprehensive pool of data to provide context or back up one’s
conclusions is one thing. Organizing it in a way to facilitate further
inquiry is another. Will Microsoft be able to shoulder aside existing BI
specialists? Building the technology into Excel itself is a good start.


 Microsoft
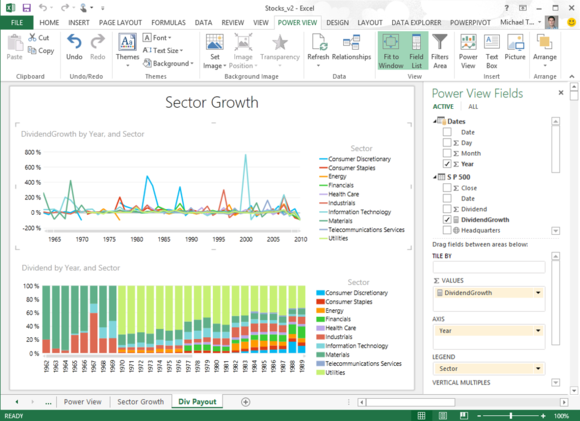
 Microsoft
No comments:
Post a Comment